Wednesday, July 30, 2008

DEM

This digital elevation model, or DEM, of the Dundas Valley, in Hamilton, Ontario, CA has been colorized to bring out the relief. The lower elevation values are shaded in green while the higher ones are orange. It looks like they have overlaid the DEM with a layer of street data for reference. If this map is used for public display, the street data would certainly help give people a better understanding of location. By rotating this DEM you might get a better view of the elevations and really see the differences across the subject area. This site has some fantastic images and maps.

Link to website:
http://map.hamilton.ca/maphamilton/S_Files/aboutimages.aspx

DLG

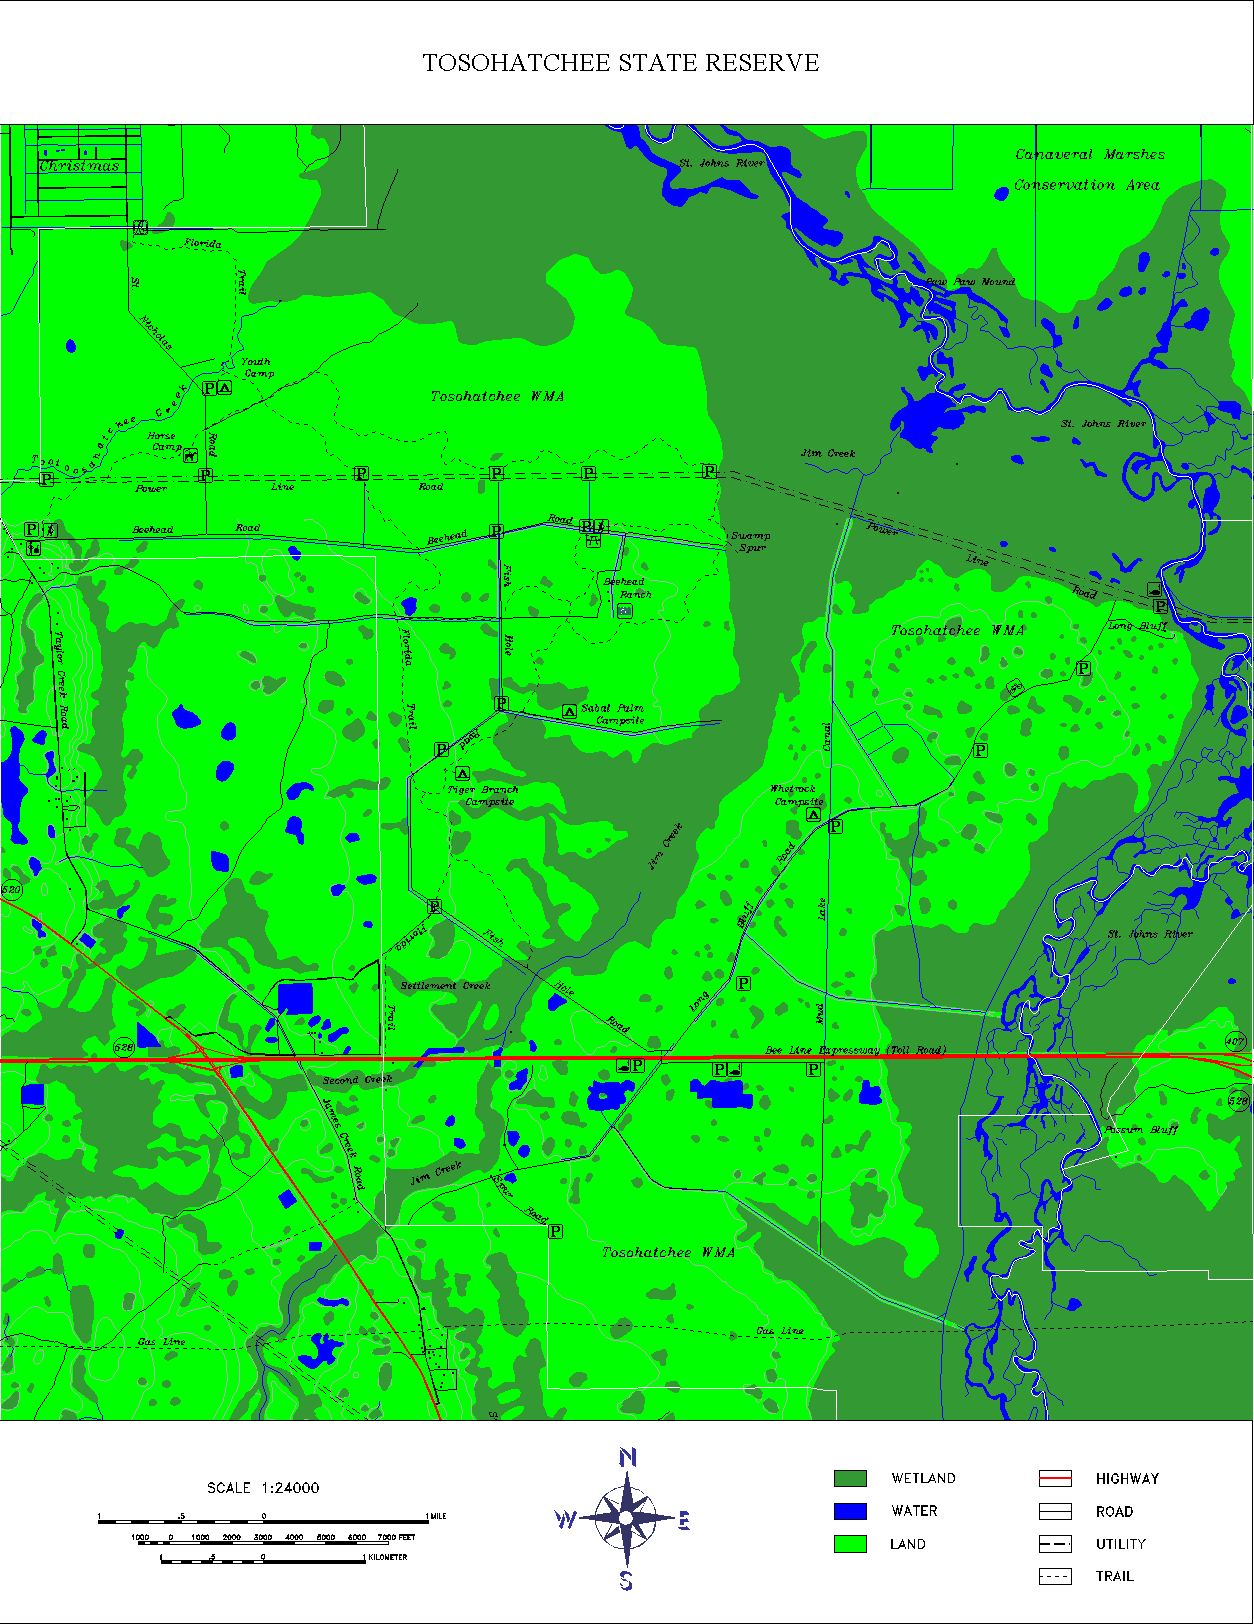
A digital line graph (DLG) contains a wide variety of information like topography, hydrography, boundaries, roads, and utility lines. The data is in vector format and the map features are stored as points, lines, and polygons. This is a map of the 28,000 acre Tosohatchee State Reserve in Orange County, Florida which includes USGS DLG data to show the streams, rivers, lakes, wetlands, roads, railroads, power lines, buildings and other geographic and man-made features. It might also be classified as a hypsometric map because a third variable is represented by the use of different colors to delineate wetlands, water and land. There are also lines that may/may not be contours showing the shape and elevation of this area. The website has some great information about this reserve and several different detailed maps for public use.

Click twice on the map to get a large, clear image.

Link to website:
http://www.outintheboonies.com/Tosohatchee/

DRG

A digital raster graphic (DRG) is a scanned and georectified image of a USGS standard series topographic map. This DRG of Wyoming is a digital map product available for free download from the website listed below. It is not a very clear picture but you can make out the topography and use it for doing work in a GIS. Because it is georectified, it contains spatial reference information that will communicate the spatial location of features on the map. The raster format records, stores and processes cartographic data in a cell or pixel. Of course, you have to be careful with the sources for DRGs and make sure you know how they are georeferenced.

If you click the map twice the image is a bit clearer.

Link to website:
http://wgiac.state.wy.us/scripts/DRGMAP/DRGmap.aspx?Area_Type=250K

ISOPLETH MAP

According to one of our reading assignments, an isopleth is a line of equal value and contouring is the process of drawing isopleths. Several of the previous maps collected for my project could fall into this category. I think isobars, isotachs, isohyets and isopachs would all be considered isopleths. These maps are commonly used for mapping surface elevations, amounts of precipitation, atmospheric pressure, and numerous other measurements that can be viewed statistically as a third dimension. The map I have chosen is a good illustration of isopleth lines showing field pH levels recorded across the United States. It is listed by the North Fork Watershed Association in Brookville, PA as an example in the study of acid deposition and its relation to air pollution.

Link to website source:
http://nfwatershed.org/templates/System/details.asp?id=40322&PID=490669

ISOPACH MAP

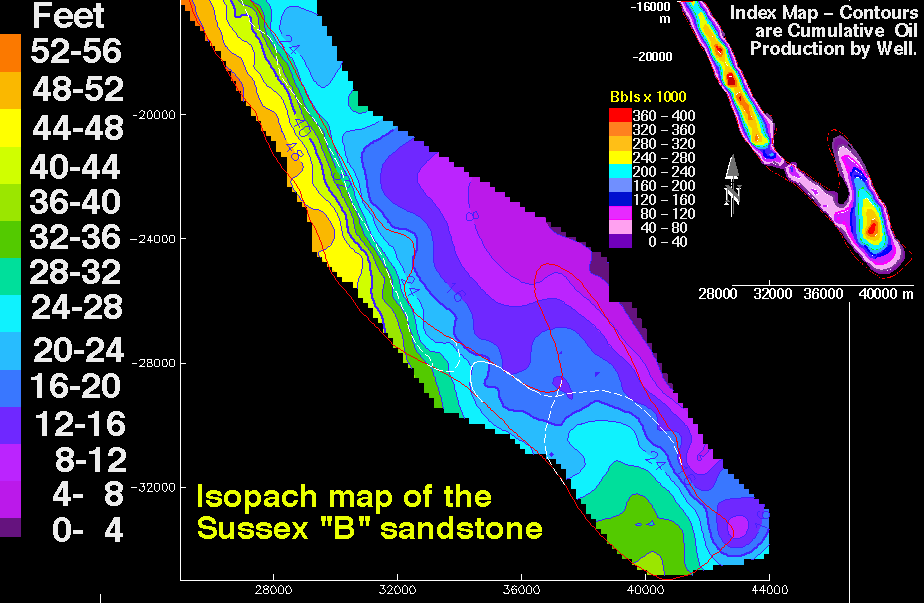
An isopach map displays the stratigraphic thickness of a rock unit and is generally used in geological exploration for oil and for underground structural analysis. This particular isopach map created by the US Geological Survey is part of a reservoir characterization of the House Creek Oil Field, Powder River Basin in Wyoming. It is showing the thickness (in feet) of Sussex "B" sandstone. If I understand the illustration correctly, by looking at the small inset map of oil production, the higher producing wells are located where the sandstone is thicker.

Link to website source:
http://pubs.usgs.gov/dds/dds-033/USGS_3D/ssx_txt/all.htm

Friday, July 25, 2008

ISOHYETS

An isohyet is a line joining points of equal precipitation. This is a very pretty map of Tasmania showing mean annual rainfall in millimeters. It is obvious that rainfall is more concentrated in the southwest part of the state while the southeast is dry and the northeast has one area getting moderate rain. The prevailing wind pattern is from west to east, similar to the U.S., so the moisture is falling before it reaches the east reducing the chances of rain. I would like to see a map of the biomes for this area which are created and impacted by this climatic pattern. The source of this map is the Bureau of Meteorology, Hobart.

Link to website source:
http://soer.justice.tas.gov.au/2003/image/265/index.php

ISOTACHS

I chose this map to illustrate isotachs just because it is terribly obnoxious but does get the message across! The blue lines filled in with bright shades of green and yellow are connecting points of equal wind speed. They are using contours and color to represent the third variable and it certainly shows up on the black background. I did have to take a second look to see what the map was since the states are outlined in a very pale orange color and the white isobars look like they are on top of the other layers. It is interesting how both sets of contour lines follow a similar pattern starting in the north and making a sweep south and back up. This is a pretty neat comparison of the two variables together on a map dated October, 1996.

Link to website source:
http://www.atmos.washington.edu/~mcmurdie/oct96/oct96_labs.html