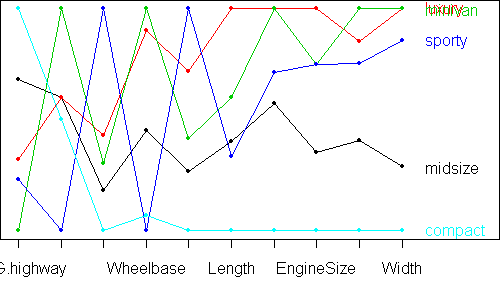
 In this parallel coordinate graph/plot they have included five vehicle types on the vertical axis and although they are not all visible on the image, ten variables along the horizontal axis. The following variables are represented by dots along each line: MPG – highway, passengers, horsepower, wheelbase, price, length, turn radius/circle, engine size, weight, and width. All of these variables are easily compared for each vehicle type using this chart and relationships between the variables can be established. For example, as horsepower increases so does the price.
 Link to website source:
http://alumni.media.mit.edu/~tpminka/courses/36-350.2001/lectures/day38/
No comments:
Post a Comment