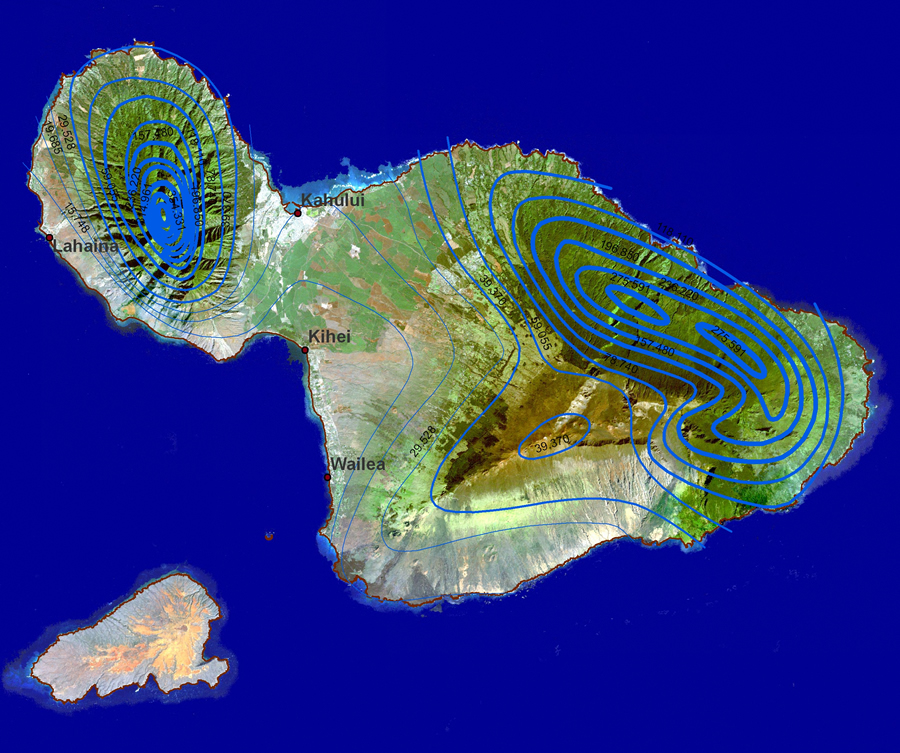
This is an interesting isoline map from an article published by ESRI about how GIS is being used in education. The isolines represent rainfall ranges in Maui, Hawaii and they are laid over a Landsat image. The range is drastic in some areas and this jpg really demonstrates the affects of rainfall amounts on land cover and use. It is an amazing illustration of how climate impacts the surface of the earth. The isolines just seem to highlight the areas of changing vegetation and color.
Cool map!
Link to website source:
http://www.esri.com/news/arcwatch/0207/feature.html
No comments:
Post a Comment