Tuesday, August 5, 2008

STATISTICAL MAP

After taking another look at what a statistical map is really about, I realized that the one I first posted does not really qualify. However, based on the definition from our slides, this map (aka cartogram) can be called statistical because the shape and size of each country is based on a statistic - percentage of the population who are female agricultural workers. It looks like most of them are concentrated in undeveloped or developing countries while developed countries like the US have a lower percentage. This website has a great collection of this type of map.

Link to website source:
http://ifyouonlyreadonethingthisweek.wordpress.com/2007/11/01/world-mapper-re-invisioning-the-world/

Monday, August 4, 2008

PROPAGANDA MAP

I added another propaganda map because the one I posted early in the term is included in the slides for week 11. This one may just be a humorous response to another map which shows the southwestern states combined with Mexico to create the “new country” of Aztlan. It clearly defines and highlights Mexico (yours) and its borders while a message is boldly printed across most of the US (not yours). Most viewers would certainly get the point of this map and many would probably take offense.

Link to website source:

Sunday, August 3, 2008

CHOROPLETH MAP

I had to include one more choropelth map which illustrates the Muslim population in Africa, 2005. I think it could be considered classed because the data has been divided into intervals and standardized because the data has been areally averaged to get a percentage. Based on this graphic, the Muslims seem to be more concentrated in North Africa.

Link to website source:http://www.usip.org/pubs/specialreports/sr140.html

DOT DISTIBUTION MAP

This is just an interesting dot distribution map I found showing the principle cotton producing areas in Florida, 1850. I like the simplicity of the map and noticed a familiar pattern of the areas dominated by plantations today. This website has some great maps of Florida.

Link to website source:
http://www.luddist.com/map.html

STAR PLOT


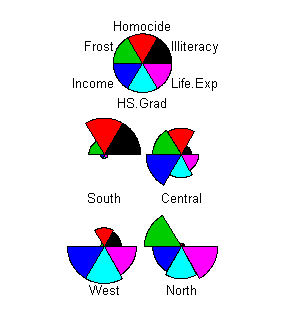
This star plot is related to the parallel coordinate graph that I have in my map collection. It allows you to visually compare the ten variables for each vehicle type side by side. You can easily distinguish the variables for each type of vehicle and determine what is most important to you in choosing one of them.

Link to website source:
http://alumni.media.mit.edu/~tpminka/courses/36-350.2001/lectures/day38/

CORRELATION MATRIX

This gene to gene correlation matrix is part of an expression analysis from the Bioinformatics Group, CSIRO Livestock Industries in Australia. It indicates the strength and direction of a linear relationship between two random variables on a scale of negative one to one. The matrix contains a subset of the top 100 cancer genes with thick lines indicating the following blocks: A - extracellular matrix, B - nucleus and cell progression, C - actin cytoskeleton, D - fatty acid metabolism, and E - glutamine/glutathioine/oxidative.

Link to website source:
http://www.livestockgenomics.csiro.au/Genome_to_Phenome/

SIMILARITY MATRIX

A similarity matrix shows similarity between variables on a scale. They seem to be most popular in studying genetics but this one is being used to study temporal event clustering of digital photo collections and user retrieval times on a scale from zero to one. This matrix visualizes the temporal similarity of a collection of 512 photos.

Link to website source:
http://www.fxpal.com/?p=eventDetector

STEM AND LEAF PLOT

This is a very simple example of a stem and leaf plot showing the number of students enrolled in a dance class in the past twelve years. The number of leaves (12) is equal to the number of data items in the diagram. The total number of students is 1146 calculated by adding all the plotted the numbers (81, 84, 85, 86, 93, 94, 97, 100, 102, 103, 110, 111). The average and the median of these numbers are 95.5 students.

Link to website source:
http://www.highpointsmath.com/sitemap/Stem-and-LeafPlot.html

BOX PLOT

A box plot (box and whisker diagram) is used to present a simple graphical summary of a set of data. This one is comparing the hits on a specific website for each day of the week in 1999. It looks like the median number of hits is almost the same on Tuesdays and Wednesdays but Tuesday has the biggest dispersion of hits. Obviously more people visit this website during the week than on the weekends.

Link to website source:
http://support.sas.com/rnd/app/da/new/daunivariate.html

HISTOGRAM

This example histogram displays the tabulated frequencies of height (in feet) for a set of 31 black cherry trees. There are three trees in the 60-65ft range, three in the 65-70ft range, eight in the 70-75ft range, ten in the 75-80ft range, five in the 80-85ft range, and two in the 85-90ft range. Based on this sample, most of the trees are 75-80 feet tall and only a few are over 85 feet tall.

Link to website source:
http://en.wikipedia.org/wiki/Histogram

PARALLEL COORDINATE GRAPH

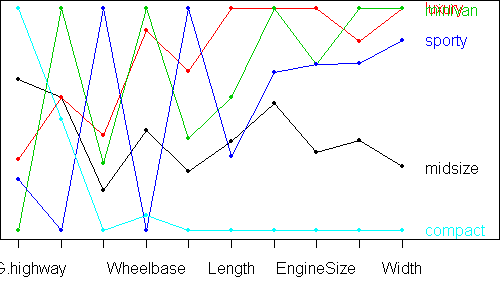
In this parallel coordinate graph/plot they have included five vehicle types on the vertical axis and although they are not all visible on the image, ten variables along the horizontal axis. The following variables are represented by dots along each line: MPG – highway, passengers, horsepower, wheelbase, price, length, turn radius/circle, engine size, weight, and width. All of these variables are easily compared for each vehicle type using this chart and relationships between the variables can be established. For example, as horsepower increases so does the price.

Link to website source:
http://alumni.media.mit.edu/~tpminka/courses/36-350.2001/lectures/day38/

TRIANGULAR PLOT

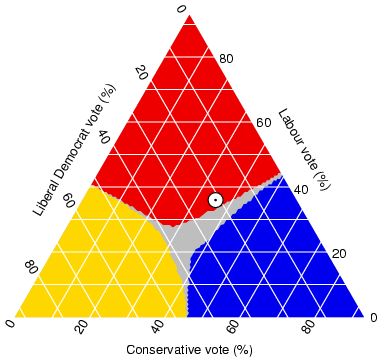
Although triangular plots are most often used to show the relative compositions of soils and rocks, it can be used for other systems combining three variables. Because I had to be different, I chose this one created in 2005 by someone estimating the probable outcome of the election in the UK. It reflects the estimated fraction of the population intending to vote for each of the following major parties: liberal democratic, labour and conservative. The current (at the time of this publication) estimate from opinion polls is indicated on the triangle by a white circle. The colored areas show the regions in which each of the corresponding major parties would win a majority in Parliament.

Link to website source:
http://ex-parrot.com/~chris/wwwitter/20050407-it_doesnt_matter_how_you_vote_either_way_your_planet_is_doomed.html

WINDROSE

A windrose, by definition from our slides, is a circular plot showing frequencies of different wind directions. This one is the current data from Holy Cross Airport Station in Alaska illustrating the hourly average wind data for July 28-Aug 3, 2008. If you look at the plot, the wind blew from the southwest about 19% of the time and never from the direct south or east. A simple graphic like this makes it easy to communicate data.

Link to website source:
http://www.yukon-watershed.org/yukon_river/stations/Holy_Cross/hcross.shtml

CLIMOGRAPH

This climograph is a graphic representation of the relationship between temperature and precipitation plotted at monthly intervals for a year in Manaus, Brazil. The blue line is precipitation in inches on the right axis and the shaded green bars reflect temperatures in degrees Fahrenheit on the left axis. These two variables seem to have an inverse relationship in Manaus reflecting slightly higher temperatures with less precipitation and a bit lower temperatures with more precipitation. The temperature does not fluctuate a lot in this area of the tropical Amazon region but they do have a wet season and a dry one.

Link to website source:
http://www2.volstate.edu/kbell/climographs.htm

POPULATION PROFILE

This is a population profile/pyramid displaying the age and sex distributions of British Columbia, Canada, 1996. It reflects a larger percent of the population falling in the middle age ranges between 35-49 years old. Based on this profile and information from the website, I would have to conclude that the fertility rates are decreasing and the death rates are decreasing. It might be interesting to see the current pyramid for this province and if the aging trend has continued.

Link to website source:
http://atlas.nrcan.gc.ca/site/english/maps/peopleandsociety/age/age1996/bc_graph.gif/image_view

SCATTERPLOT

This scatterplot shows the relationship between population and the gross domestic product (GDP) per state based on 2005 data. The red trend line reflects an average ratio for the US which generally indicates an increase in GDP relative to an increase in population. As you can see on the graphic, there are a few exceptions to this but there is a fairly strong, positive relationship between the two variables. The states that fall farther below and to the right of the average have healthier economic productivity.

Link to website source:
http://www.economics-charts.com/gdp/GDP-Per-Capita-scatter-plots.html

INDEX VALUE PLOT

An index value plot uses a calculated index value instead of an absolute number. This particular graph is using a woodland index value to plot the condition indices for three sample sites within the study area over a five year period. The focus of the project is on two sites within the southwest agricultural region of Western Australia and they used remotely sensed data. On this plot an increase in the index value is associated with a decline in condition so one site is getting better, one is getting worse and one has not changed.

Link to website source:
http://www.cmis.csiro.au/rsm/research/remveg/vegassess_all.html

Saturday, August 2, 2008

ACCUMULATIVE LINE GRAPH

In 2007, the "new government" of Scotland used this accumulative line graph (Lorenz curve) to show fairness in terms of income and promote their agenda of increasing wealth and fairness. This chart does show a slight increase in equality from 2000/01 to 2005/06 but can the perfect line be realized? Like in most places, I think this is a great concept or goal but a hard one to accomplish. The Lorenz curve is a great visual for realizing inequalities and illustrating how a small percent of the population earns a larger amount of the income.

Link to website source:
http://www.northlan.gov.uk/business+and+employment/local+economy/economic+information/economic+bulletin+8+-+policy+round+up.html

BILATERAL GRAPH

This bilateral graph dated 1991 displays the birth and death rates for Sri Lanka. These two related variables are combined to calculate the natural rate of population increase or decrease. Since the poorer countries of the world are seeing better public health, the death rates are dropping. Although a little behind, the decrease in birth rates may be attributed to better opportunities and education for women. It could also be related to health and lower numbers of infant/child deaths that might contribute to more births. Based on previous studies, most developed countries have experienced this type of trend and the developing ones probably have similar current graphs. These trends are the result of improvements in sanitation, better nutrition and access to medication/health care.

Link to website source:
http://users.rcn.com/jkimball.ma.ultranet/BiologyPages/P/Populations.html

NOMINAL AREA CHOROPLETH MAP

Both of these maps are examples of a nominal area choropleth map showing Florida voting party trends from 2000. The cartographer was interested in loyalty/disloyalty across party lines. The top map shows that Bush (red) carried more “cross-over” counties than Gore (blue) in this election. According to one paper on this subject, using nominal level data is sometimes considered a less precise level of measuring variables. It seems like many of the political maps use nominal level data for public presentations. Maybe they are trying to make it “blue and red and simple all over” for ease of understanding.

Link to website source:
http://www.directionsmag.com/mapgallery/?MapId=124