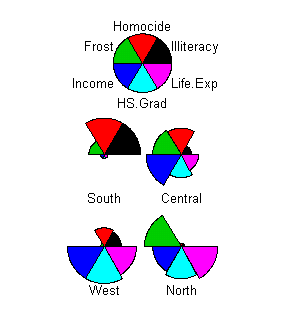
This star plot is related to the parallel coordinate graph that I have in my map collection. It allows you to visually compare the ten variables for each vehicle type side by side. You can easily distinguish the variables for each type of vehicle and determine what is most important to you in choosing one of them.
Link to website source:
http://alumni.media.mit.edu/~tpminka/courses/36-350.2001/lectures/day38/
Link to website source:
http://alumni.media.mit.edu/~tpminka/courses/36-350.2001/lectures/day38/
No comments:
Post a Comment